The long way around: how the Red Sea shock redrew Africa's maritime map
— Two and a half years after security risks emptied the Suez corridor, the Cape of Good Hope is still the default route between Asia and Europe. Egypt counts the cost; East Africa banks a windfall; South Africa is left asking what might have been.
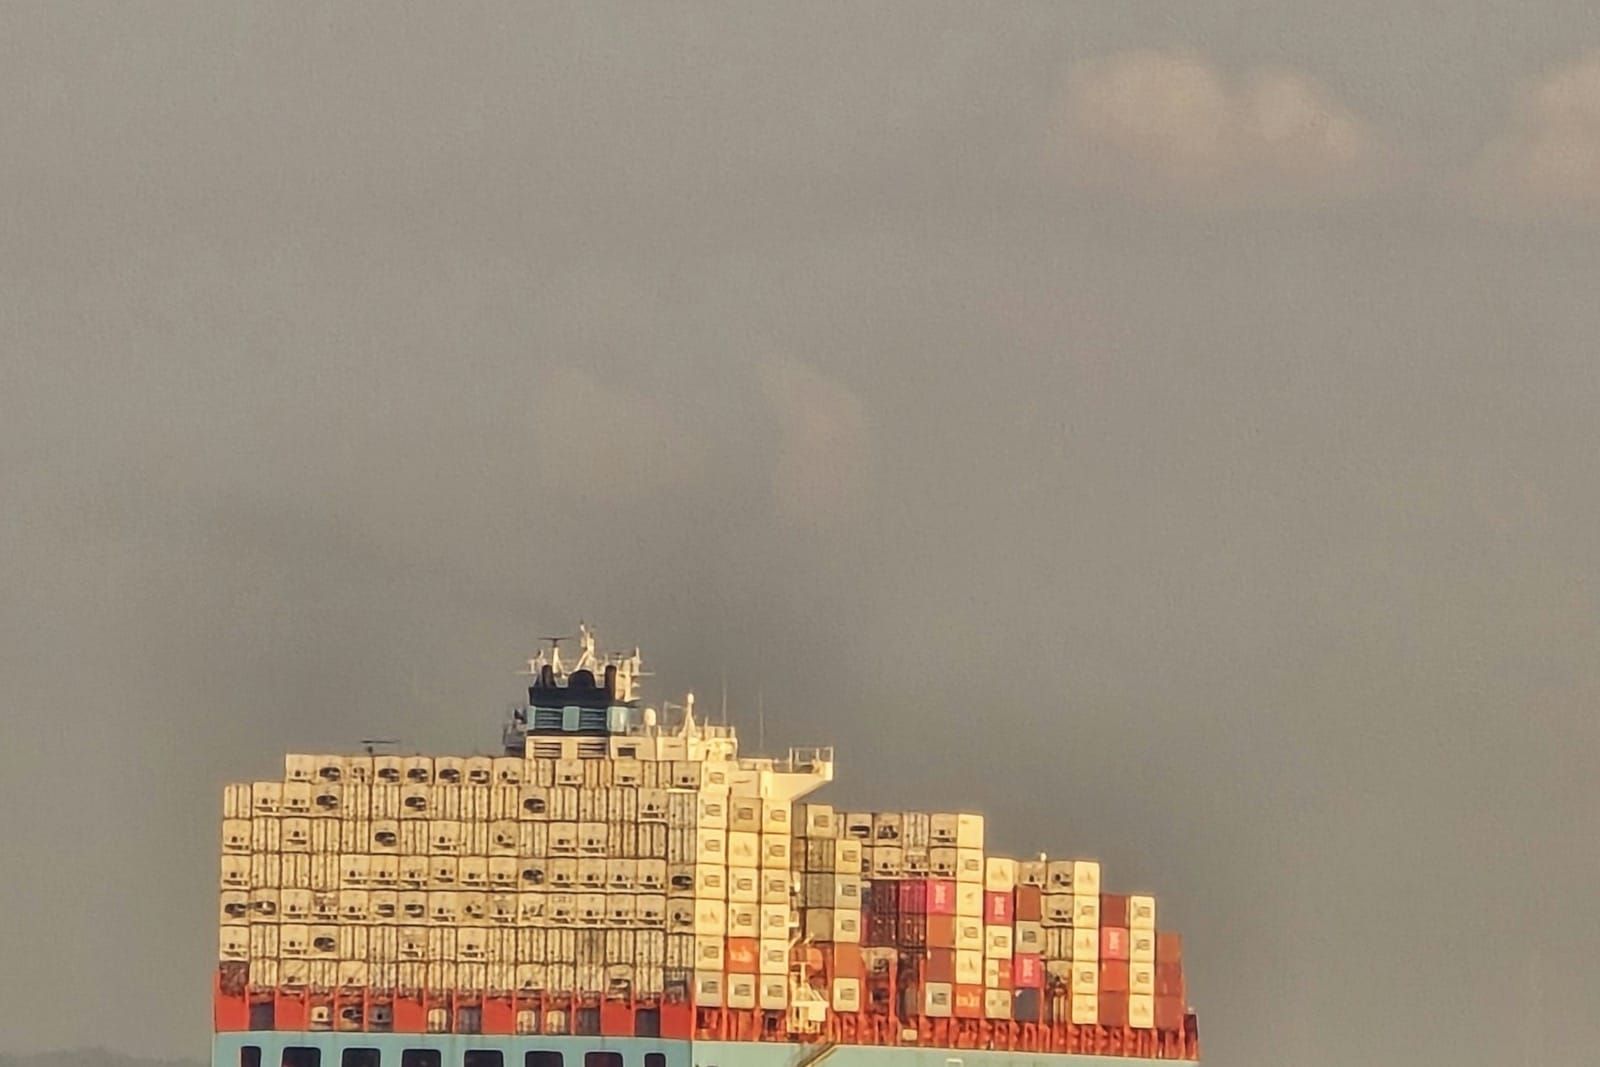
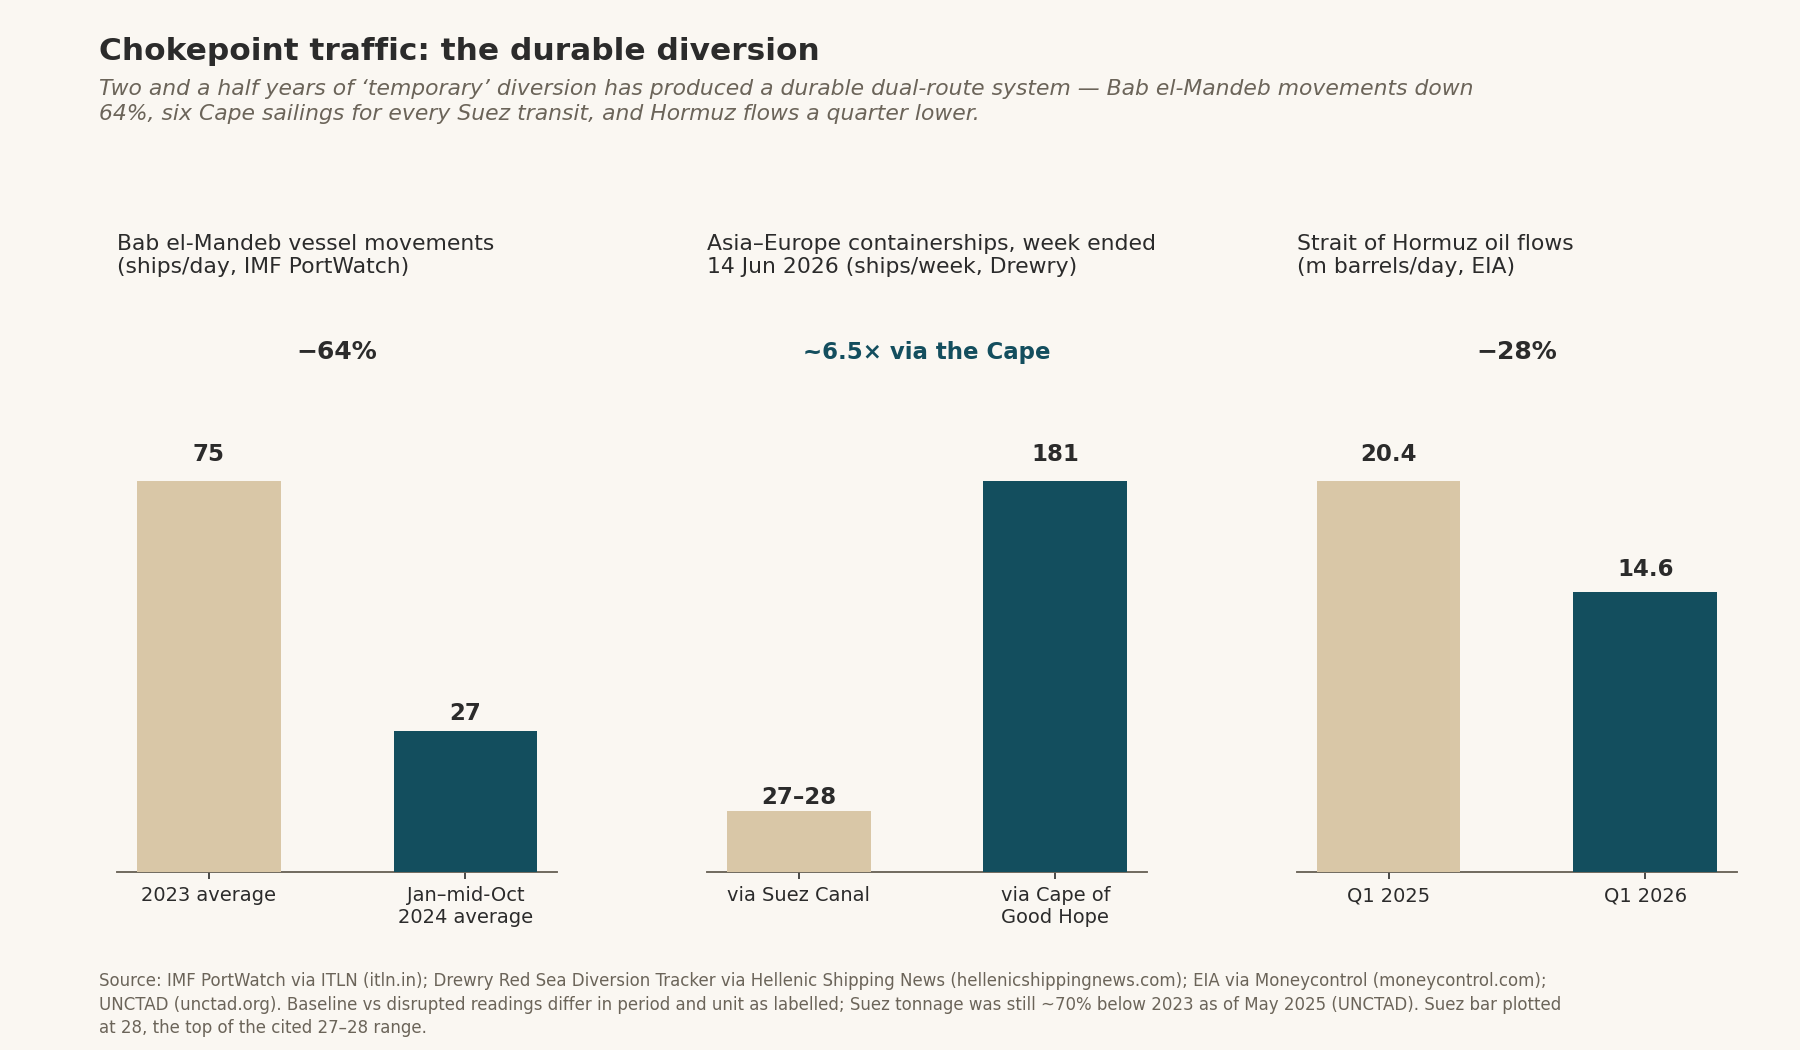
--- In the week ended 14 June 2026, 181 container ships sailed between Asia and Europe around the Cape of Good Hope; 27 or 28 passed through the Suez Canal, according to Drewry's Red Sea Diversion Tracker via Hellenic Shipping News. Two and a half years after security risks first emptied the corridor, the emergency route is simply the route. The geography of Afro-Eurasian trade has been redrawn — and the bill, the windfall and the bottlenecks are all African.
The diversion, in numbers
The Suez corridor normally carries about 12–15% of global trade and roughly 30% of global container traffic — the conventional planning range cited by UNCTAD and the World Bank; alternative estimates exist. Attacks on commercial shipping by Yemen's Houthi movement began in November 2023 with the seizure of the Galaxy Leader. Between November 2023 and October 2025, more than 100 attacks were recorded, affecting vessels from over 60 nations; two bulk carriers were sunk in July 2025 with four seafarers killed, per a US Maritime Administration advisory via Safety4Sea.
The acute phase was brutal. Canal transits fell 42% from peak, weekly container-ship transits fell 67%, and container tonnage crossing the canal fell 82% between 1 December 2023 and 12 February 2024, with 586–621 container vessels rerouted via the Cape by mid-February, per UNCTAD's rapid assessment via WWD. Satellite tracking by IMF PortWatch via ITLN shows Bab el-Mandeb vessel movements down 64% year-on-year to 7,863 ships — a daily average of 27, against 75 a year earlier — between January and mid-October 2024; September 2024 alone was down 70%, and tanker transit calls fell about 63% year-on-year in March 2024, per ING Think. Oil rerouted with everything else: crude and products through Bab el-Mandeb fell from 8.7m barrels a day in 2023 to 4.0m in January–August 2024, while flows around the Cape rose from 6.0m to 9.2m, per EIA and Vortexa data via gCaptain.
The detour's arithmetic: roughly 3,000–3,500 extra nautical miles and 10–14 days on Asia– Europe loops; 5–7% of effective global container capacity absorbed; and ton-miles up a record 6% in 2024 — three times the growth of trade volumes — per a Frontiers review and UNCTAD.
Egypt's bill, and the freight cycle
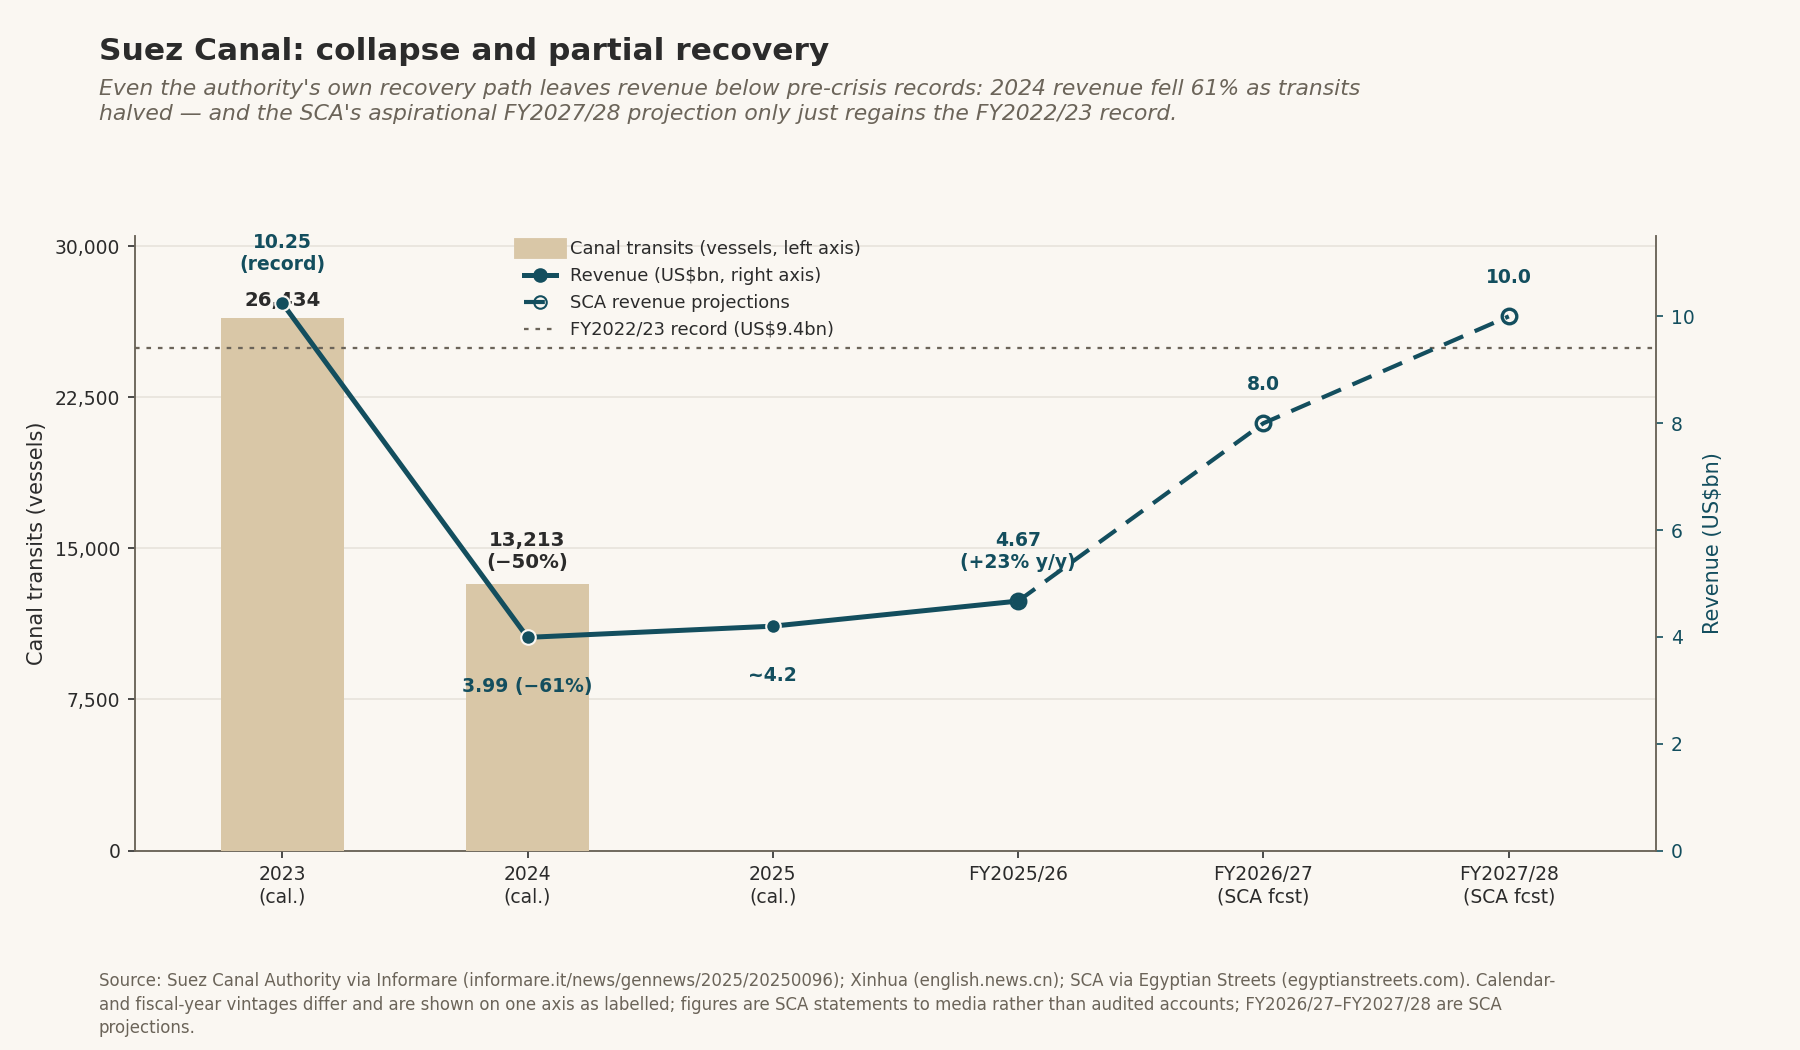
Egypt has paid the clearest bill. In calendar 2024, transits nearly halved to 13,213 vessels from 26,434 (–50%) and revenue fell to US$3.99bn from a record US$10.25bn (–61%); container transits fell 70% and LNG transits 85%, per the Suez Canal Authority via Informare. Revenue recovered to about US$4.2bn in 2025, with October 2025 bringing 229 "returning" vessels — the highest since the crisis began — per the SCA via Reuters/Baird Maritime and Business Today Egypt. Fiscal 2025/26, ended 30 June 2026, brought US$4.67bn, up 23% year-on-year, per the SCA via Egyptian Streets; the first half saw 5,874 vessels and US$1.97bn, per Xinhua, and early 2026 ran ahead of the prior year, per Daily News Egypt. The authority projects US$8bn in FY2026/27 and US$10bn in FY2027/28 — forecasts that remain aspirational, and still below the US$9.4bn record of FY2022/23. Calendar and fiscal vintages differ, and all the figures are SCA statements to media rather than audited accounts.
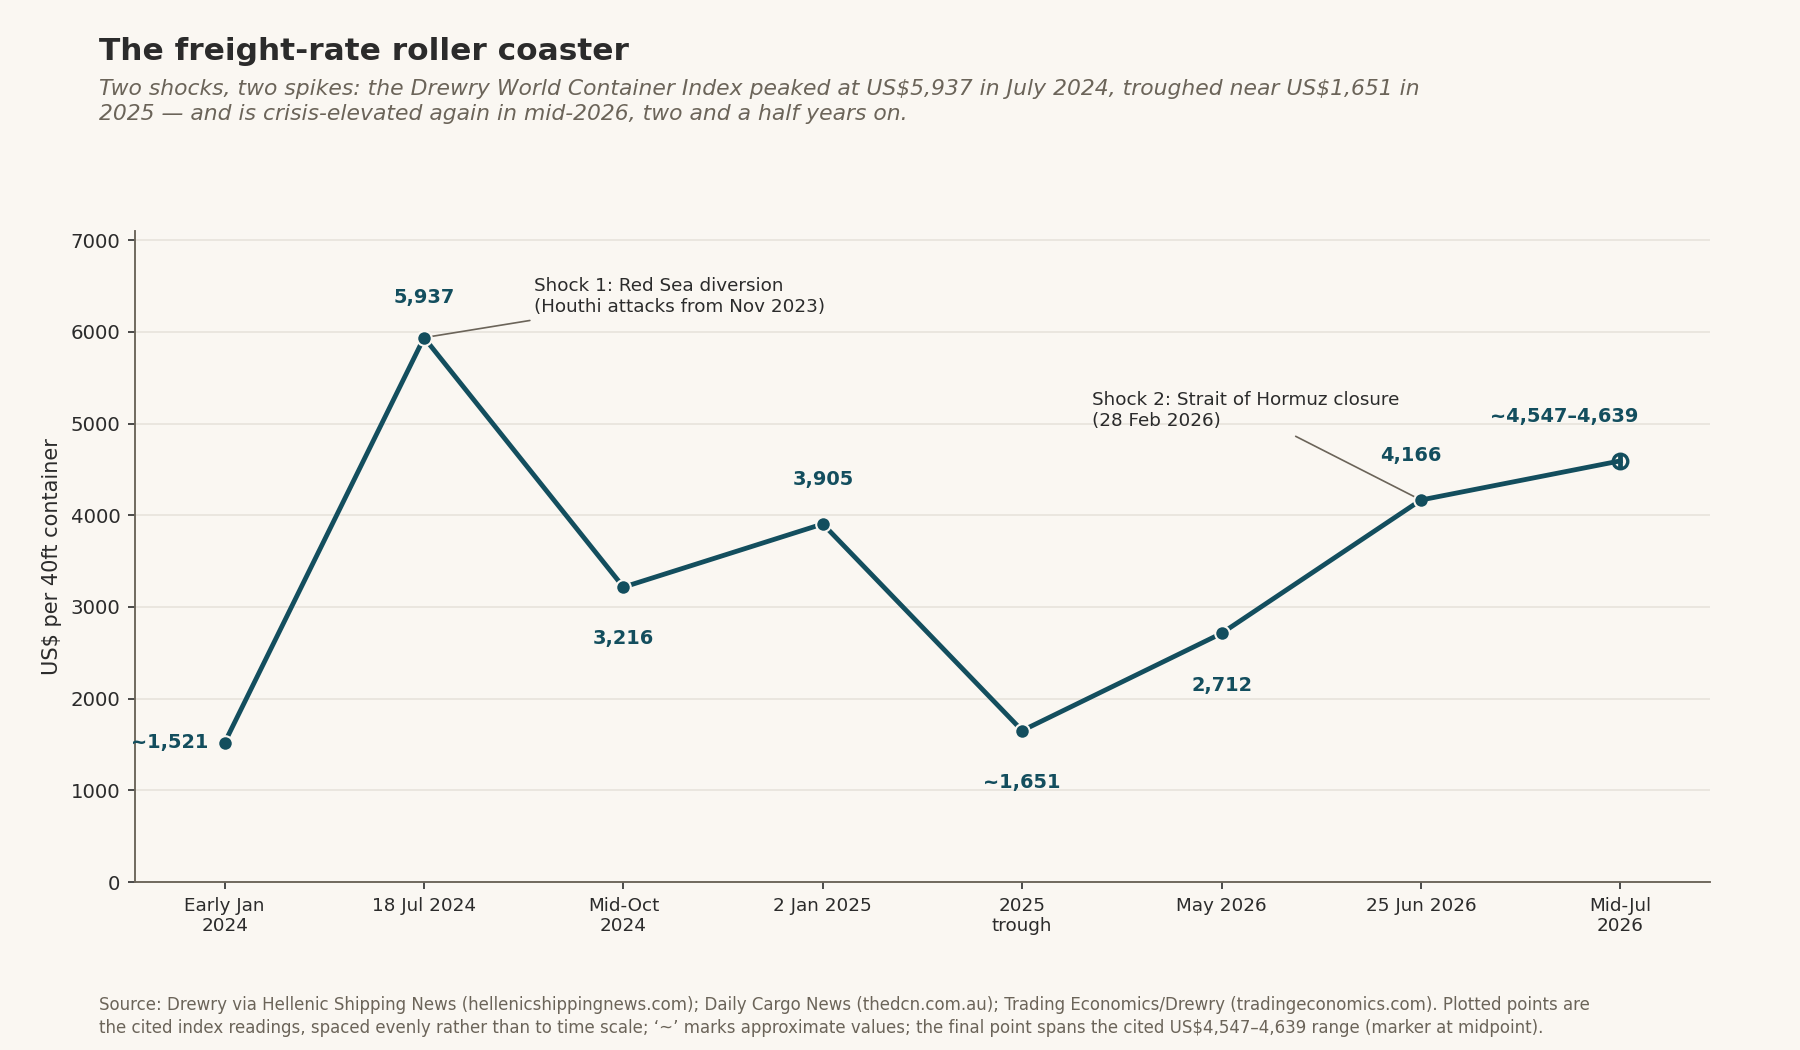
Freight rates rode the same arc. Drewry's World Container Index peaked at US$5,937 per 40-foot box on 18 July 2024, fell to a 2025 trough near US$1,651, then climbed back to US$4,166 on 25 June 2026 and about US$4,547–4,639 by mid-July 2026, per Drewry via Hellenic Shipping News, the Daily Cargo News and Trading Economics. The Shanghai Containerized Freight Index averaged 2,496 points in 2024, up 149% on 2023, per UNCTAD, which expects seaborne trade growth of just 0.5% in 2025 after 2.2% in 2024.
The real chokepoint is paper
Premiums, more than anything else, transmit the shock into prices. Red Sea war-risk insurance rose from about 0.05% of hull value before the crisis to 0.1–0.35% in January 2024 and 0.5–1.0% per voyage in early 2025, easing to about 0.2% by December 2025 after the ceasefire — broker quotes, not tariffs, varying by flag, ownership and cargo, per Frontiers/ITF and DataIntelo. In March 2026 the mechanism bit harder: major protection-and-indemnity clubs — Gard, Skuld, NorthStandard, London, American — cancelled Gulf war-risk cover between 1 and 5 March, effectively closing the Gulf to commercial traffic, per Gateway Lines, a Howden Re report and the London P&I Club.
By mid-July 2026, renewed US–Iran exchanges had pushed Gulf war-risk quotes to 3–10% of hull value — US$3–10m for a US$100m tanker, against about 0.25% before the war — according to Marsh's Marcus Baker via The National, a single credible broker quote amid active conflict that bears re-checking at press time; the IMO Secretary-General has publicly pressed insurers on pricing. Naval cover underwrote the partial normalisation: the EU's Aspides mission escorted more than 640 merchant vessels in its first year and over 1,450 across 23 months to January 2026, and its mandate now runs to 28 February 2027, with added tasks including critical subsea-infrastructure monitoring and cooperation with the Yemeni Coast Guard, per the Council of the EU and a March 2026 mandate update; the US-led Operation Prosperity Guardian ran in parallel. For African importers, an extra half-percent of hull value on every sailing is a tariff by another name.
Winners and laggards
Geography offered the windfall; infrastructure decided who banked it.
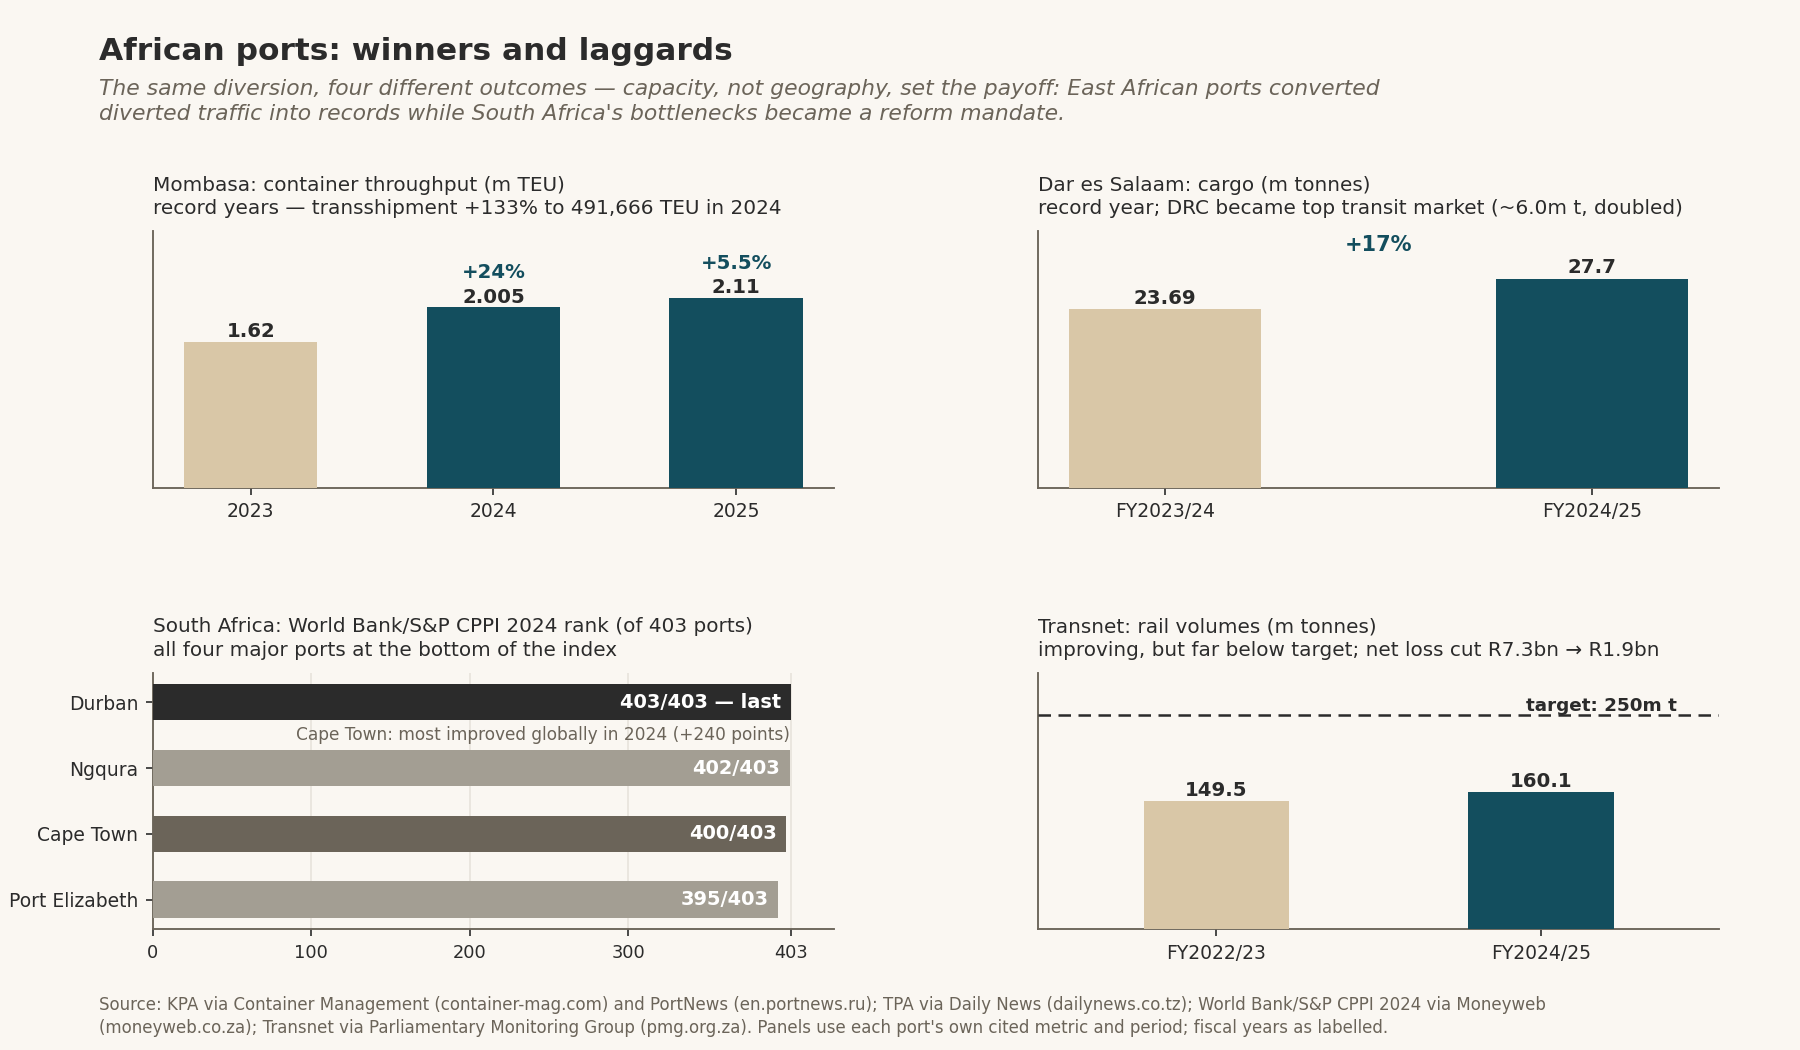
Mombasa hit a record 2.005m TEU in 2024, up 24%, then 2.11m TEU in 2025; cargo reached 45.45m tonnes, up 10.9%, and transshipment jumped 133% in 2024 to 491,666 TEU — from a low base — as lines hubbed feeders there. Congestion followed: 50,000–52,000 TEU stacked and about 20 vessels at anchor in late 2025 and early 2026, per KPA via Container
Management, PortNews and Africa Ports & Ships.
Dar es Salaam handled a record 27.7m tonnes in FY2024/25, up 17%, with container
turnaround cut from about ten days to roughly three to six — port-authority figures. The DRC became its top transit market at about 6.0m tonnes, doubled, per TPA via Daily News and Zawya; across all Tanzanian ports, cargo rose 28% and TEU 21% between July 2025 and March 2026, per TanzaniaInvest.
Walvis Bay was designated an MSC transshipment hub in early 2025, and Monjasa among others expanded African bunkering operations, per MarineLink and MCB Group.
South Africa tells the harder story. The November 2023 Durban crisis saw 60–79 vessels and 61,000–70,000-plus containers at anchorage, per Clyde & Co; the USDA assessed the diversion as adding about 10% to shipping costs for South African trade, with delays and variability worth 3.9–24.5% of cargo value — a March 2024 assessment, per USDA FAS. The World
Bank/S&P Container Port Performance Index for 2024 ranked Durban last of 403 ports, Ngqura 402nd, Cape Town 400th and Port Elizabeth 395th — though Cape Town was the most improved port globally, up 240 points — and the 2025 index kept South African ports at the bottom despite further gains, per Moneyweb, Business Day and WorldCargo News.
Reform is now the counter-argument. Transnet's FY2024/25 shows rail volumes up to 160.1m tonnes from 151.7m — against a 250m-tonne target — revenue up 7.8% to R82.7bn, the net loss cut from R7.3bn to R1.9bn, and borrowings of R144.7bn; vessel anchorage at South African ports fell about 75% between mid-2024 and August 2025, and private-sector participation at Durban Container Terminal Pier 2 is in process, per the Parliamentary Monitoring Group and The Mercury. After the Hormuz closure, Cape Town recorded a reported 112% surge in diverted vessels by early March 2026 — a Cape Chamber figure against an unclear baseline, eNCA reports — but structural constraints limited the bunkering volumes actually captured. Whether South Africa "missed" the windfall is contested: container volumes did not rise structurally, while bunkering and repair demand grew but was capacity-constrained. Both things are true.
The second shock, and what stays changed
The sequence since October 2025 reads like a stress test of normalisation itself. A Gaza ceasefire that month was followed by a Houthi halt to attacks announced in November 2025; the last attack was on 29 September 2025, per MARAD via Safety4Sea and The New Global Order. Carriers returned cautiously: CMA CGM resumed select transits from December 2025, Maersk's MECL service made the first structural return on 15 January 2026, and Gemini's ME11 followed in mid-February — all service-by-service, not network-wide, per Maersk and TrasportoEuropa. Then, on 28 February 2026, US and Israeli strikes on Iran — reported to have killed Supreme Leader Ali Khamenei — triggered the closure of the Strait of Hormuz. Tanker traffic fell about 70% within 48 hours and near-zero by 2 March, with 150–200 vessels anchored and at least 9–15 tankers damaged, per insurance and industry trackers including Gateway Lines and Howden Re; the figures may yet be revised. Maersk re-diverted services back around the Cape, per gCaptain. Oil flows through Hormuz fell from 20.4m barrels a day in Q1 2025 to 14.6m in Q1 2026, and Brent topped US$100 a barrel, before a US–Iran memorandum in June 2026 reopened the strait and flows recovered above 10m barrels a day, per EIA data via Moneycontrol and Bloomberg via GitX. Fresh US–Iran exchanges in mid-July 2026 show how reversible
normalisation is.
There is also a carbon cost. Industry emissions rose 5% in 2024; UNCTAD estimates up to 70% more greenhouse gas for a Singapore–Northern Europe round trip — a route-specific estimate that includes speed-up effects — while LSEG put a Shanghai–Hamburg voyage at 38% more CO2, per UNCTAD's Review of Maritime Transport 2025, UNCTAD via Offshore Energy and
CzApp/LSEG. Longer loops and faster steaming erode slow-steaming gains just as African ports pitch green-investment cases.
New Axis read
The crisis has not ended; it has normalised. Carriers treat dual routings as a standing operational reality, underwriters price geopolitics voyage by voyage, and naval mandates run to 2027 — all of which keeps the Cape in the network even when Suez reopens. The lesson for African governments is unglamorous: geography offered the windfall, infrastructure decided who banked it. Mombasa and Dar es Salaam converted diverted traffic into records because years of corridor investment gave them headroom; South Africa's congestion turned
opportunity into a reform mandate, which Transnet's improving numbers suggest is being executed late rather than never. Watch three dials: whether the SCA's US$8bn projection for FY2026/27 survives the next escalation; whether Mombasa's congestion spending catches up with its windfall; and whether war-risk quotes ever return to 0.05%. Chokepoint fragility is now a permanent input to African trade costs. The policy task is to price it — not to pray it away. ---
Charts & visuals
X: 181 ships a week now round the Cape; 27 take Suez. Two and a half years after the Red Sea closed, the long way is the normal way — and Africa's ports are either cashing in or clogging up.
LinkedIn: The Red Sea shock never really ended — it normalised. Our new feature traces the economics of the great diversion: Egypt's roughly US$6bn-a-year revenue loss, war-risk premiums that turned insurance into the real chokepoint, and an African port map split between East African record-breakers and South African bottlenecks. For supply-chain and trade-finance readers, the structural shift is the story: carriers, navies and underwriters are all planning for a dual-route world.
Author
Sign up for New Axis Media newsletters.
Stay up to date with curated collection of our top stories.