The 9% tax on going home: remittance costs to Africa
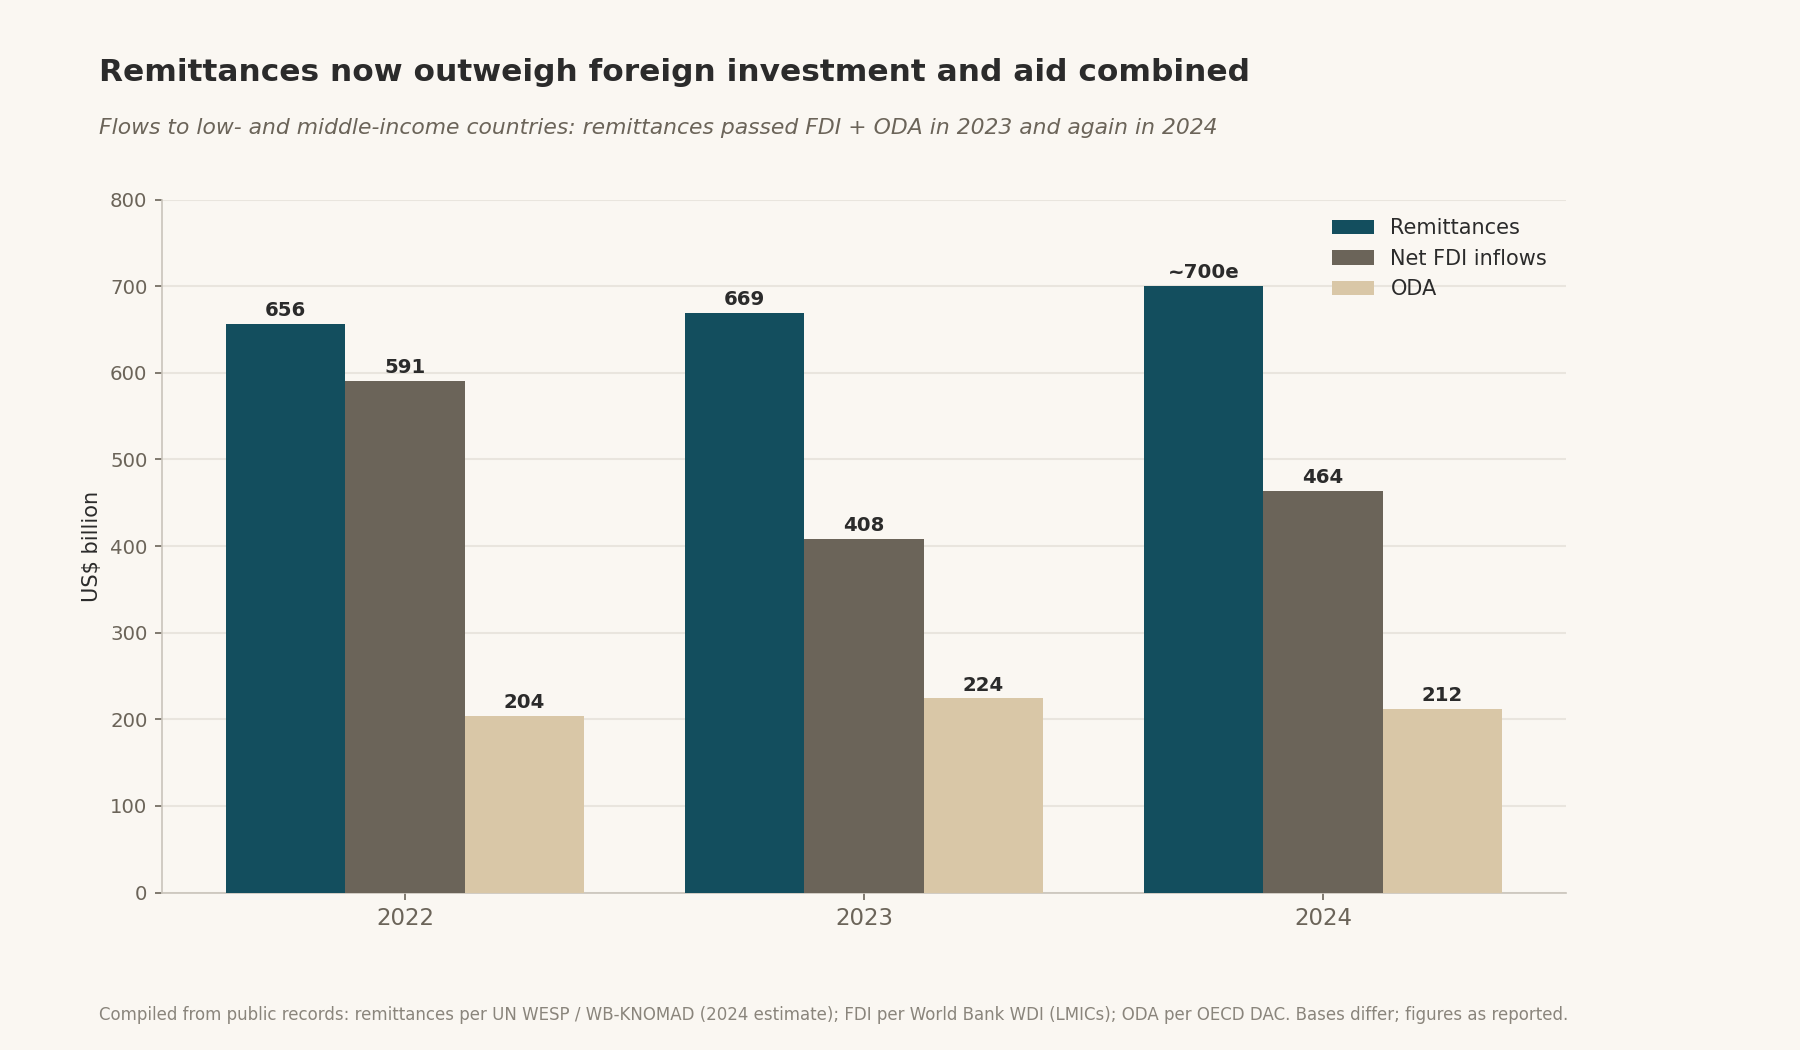
Remittances now outweigh FDI and aid combined. Sub-Saharan Africa still pays close to triple the global target to receive them.

Why it matters. Remittances are the continent's most reliable external inflow, and the fee load is a self-inflicted development tax that policy can actually change.
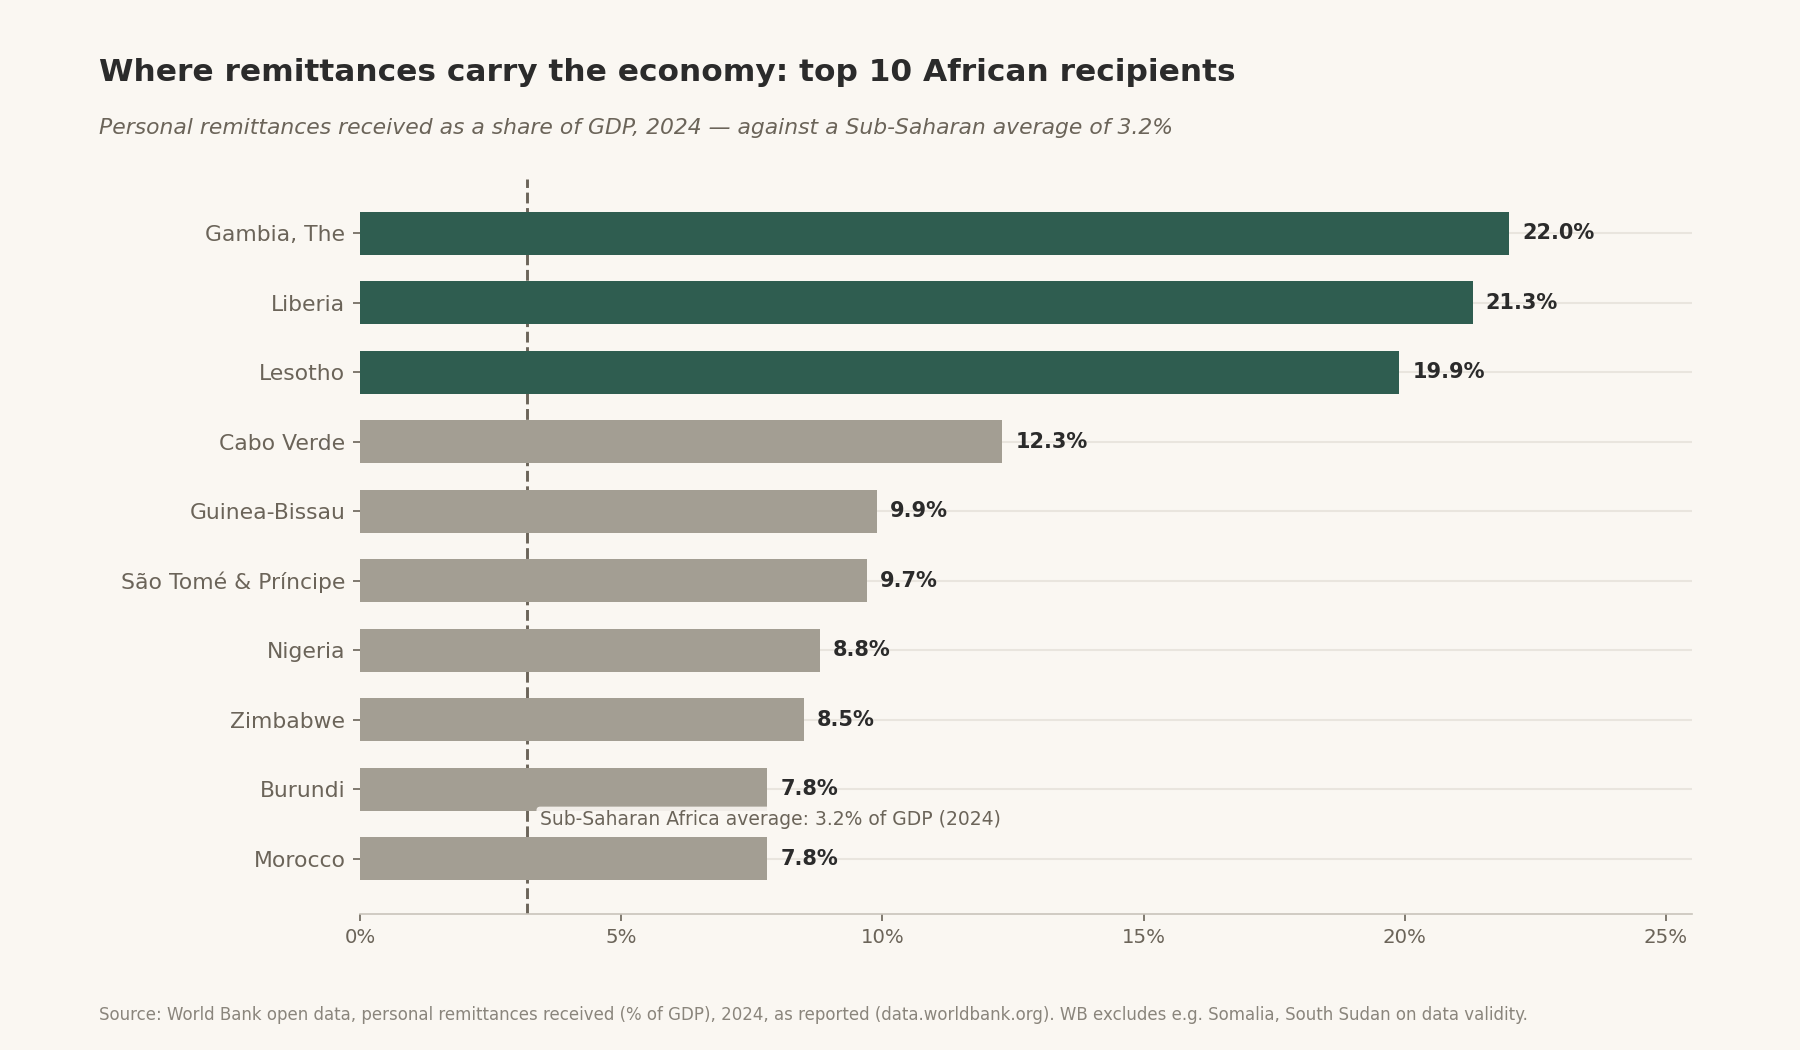
The facts. Officially recorded remittances to low- and middle-income countries reached nearly US$700 billion in 2024, up 10%, and in both 2023 and 2024 exceeded the combined total of net FDI and official development assistance, according to the UN's World Economic Situation and Prospects monthly briefing. The same briefing records that in the first quarter of 2025 the cost of sending US$200 to Sub-Saharan Africa averaged close to 9%, up from 7.7% a year earlier, against a global average of 6.4% and an SDG target of 3%. A South African Reserve Bank conference paper analysing 1,326 observations from the World Bank's Remittance Prices Worldwide database puts the Q1 2025 Sub-Saharan average at 8.78% versus a 6.49% global average, and attributes the gap to financial infrastructure gaps, regulatory fragmentation, and limited price transparency rather than to random variation — see the SARB cross-border payments paper. On volumes, the World Bank's Migration and Development Brief 40 recorded Sub-Saharan African inflows of US$54 billion in 2023 at an average sending cost of 7.9%, while RemitSCOPE's Africa overview estimates continent-wide inflows of about US$104 billion in 2024 — roughly twice ODA — with 19 of 54 African countries dependent on remittances for at least 4% of GDP. World Bank open data puts personal remittances received across Sub-Saharan Africa at 3.2% of GDP in 2024, per the Sub-Saharan Africa country data page.
Context. Cost is corridor-specific: intra-African corridors and cash-out-heavy routes are typically the most expensive, while digital-to-digital transfers are cheapest. Rising costs in 2024– 25 ran against the direction of the SDG target.
Between the lines. A three-percentage-point excess over the global average on roughly US$100 billion of flows is measured in billions of dollars a year of household income transferred to intermediaries. The named causes are policy-addressable: interoperable instant payment systems, digital ID for low-cost KYC, and licensing that admits non-banks. The absence of movement is a regulatory choice, not a market inevitability.
What to watch. Q1 and Q2 2026 Remittance Prices Worldwide releases; progress on cross-border instant payment interconnection; the next World Bank migration brief's Sub-Saharan volume estimate; and whether Egypt's surge continues to distort Africa-wide totals.
Method and sources. UN WESP monthly briefing for global aggregates and cost trends, the SARB conference paper for corridor-cost decomposition, World Bank Migration and
Development Brief 40 for 2023 volumes, World Bank open data for the GDP share, and RemitSCOPE for continent-level estimates. Figures from different vintages are labelled by year rather than blended.
Related reading: Africa's 2026 borrowing window; The compact era.
Charts & visuals
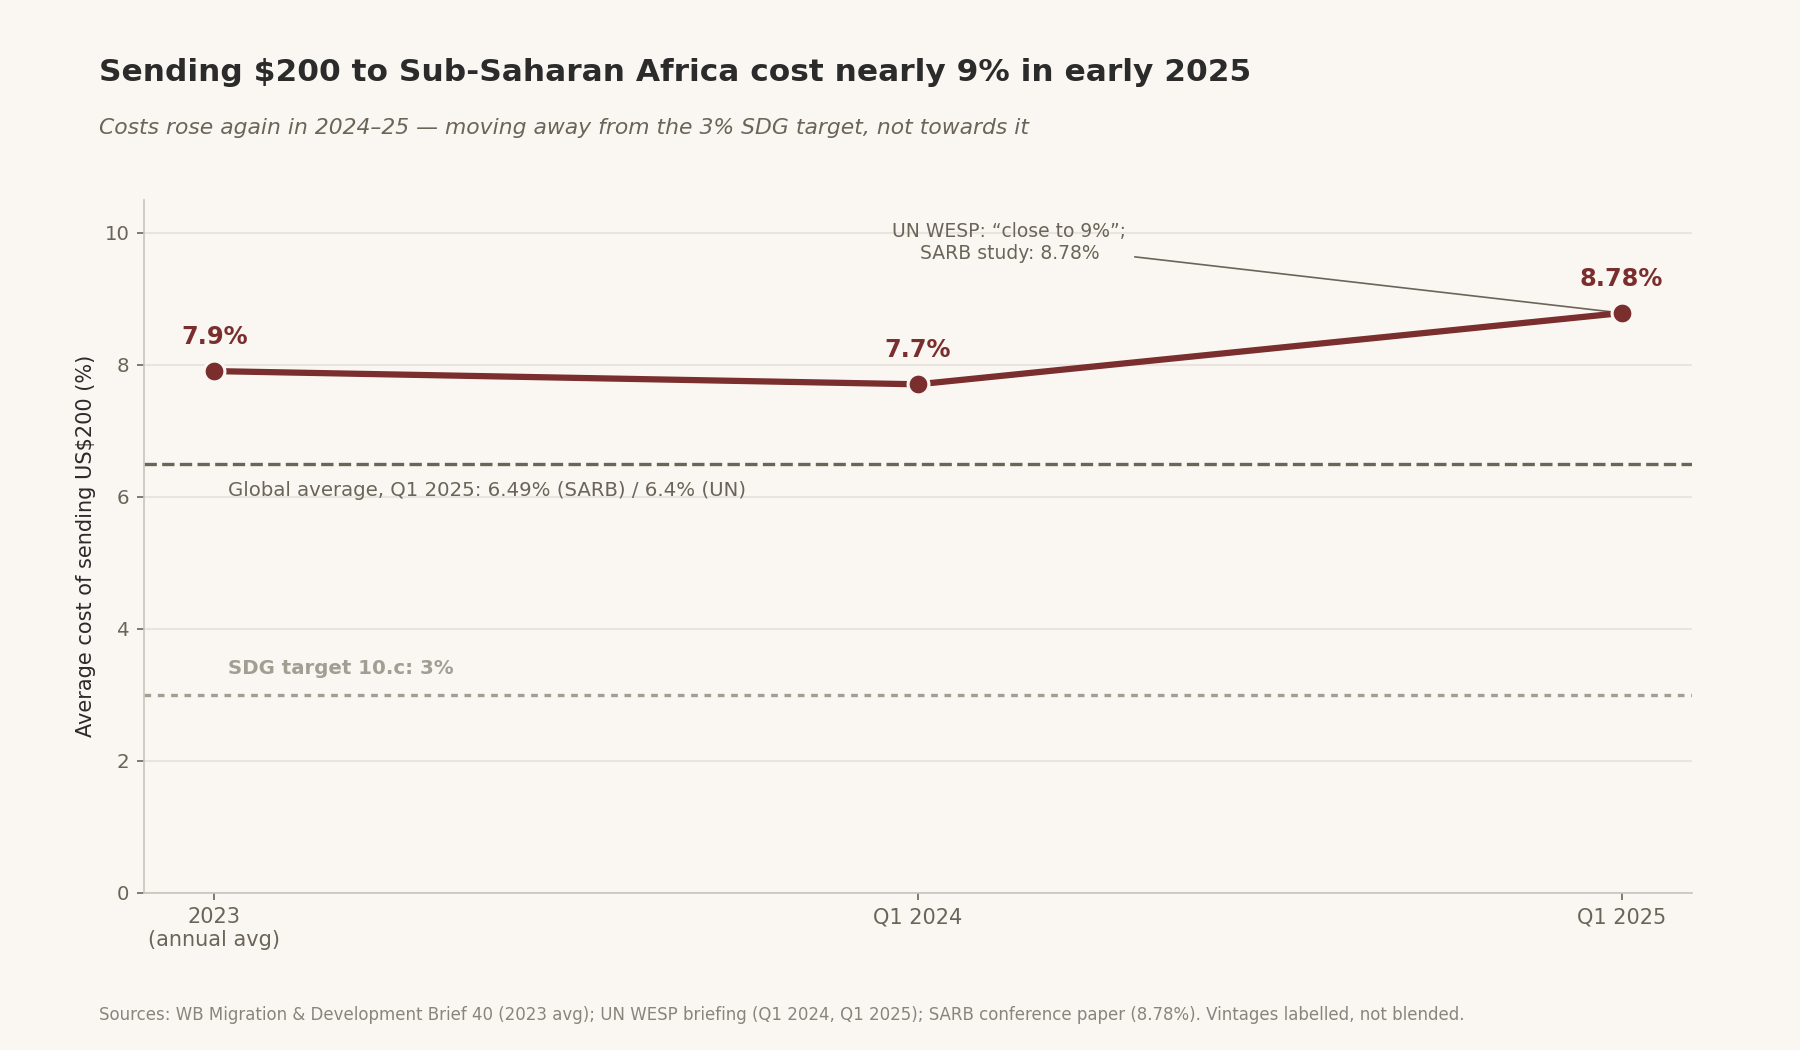
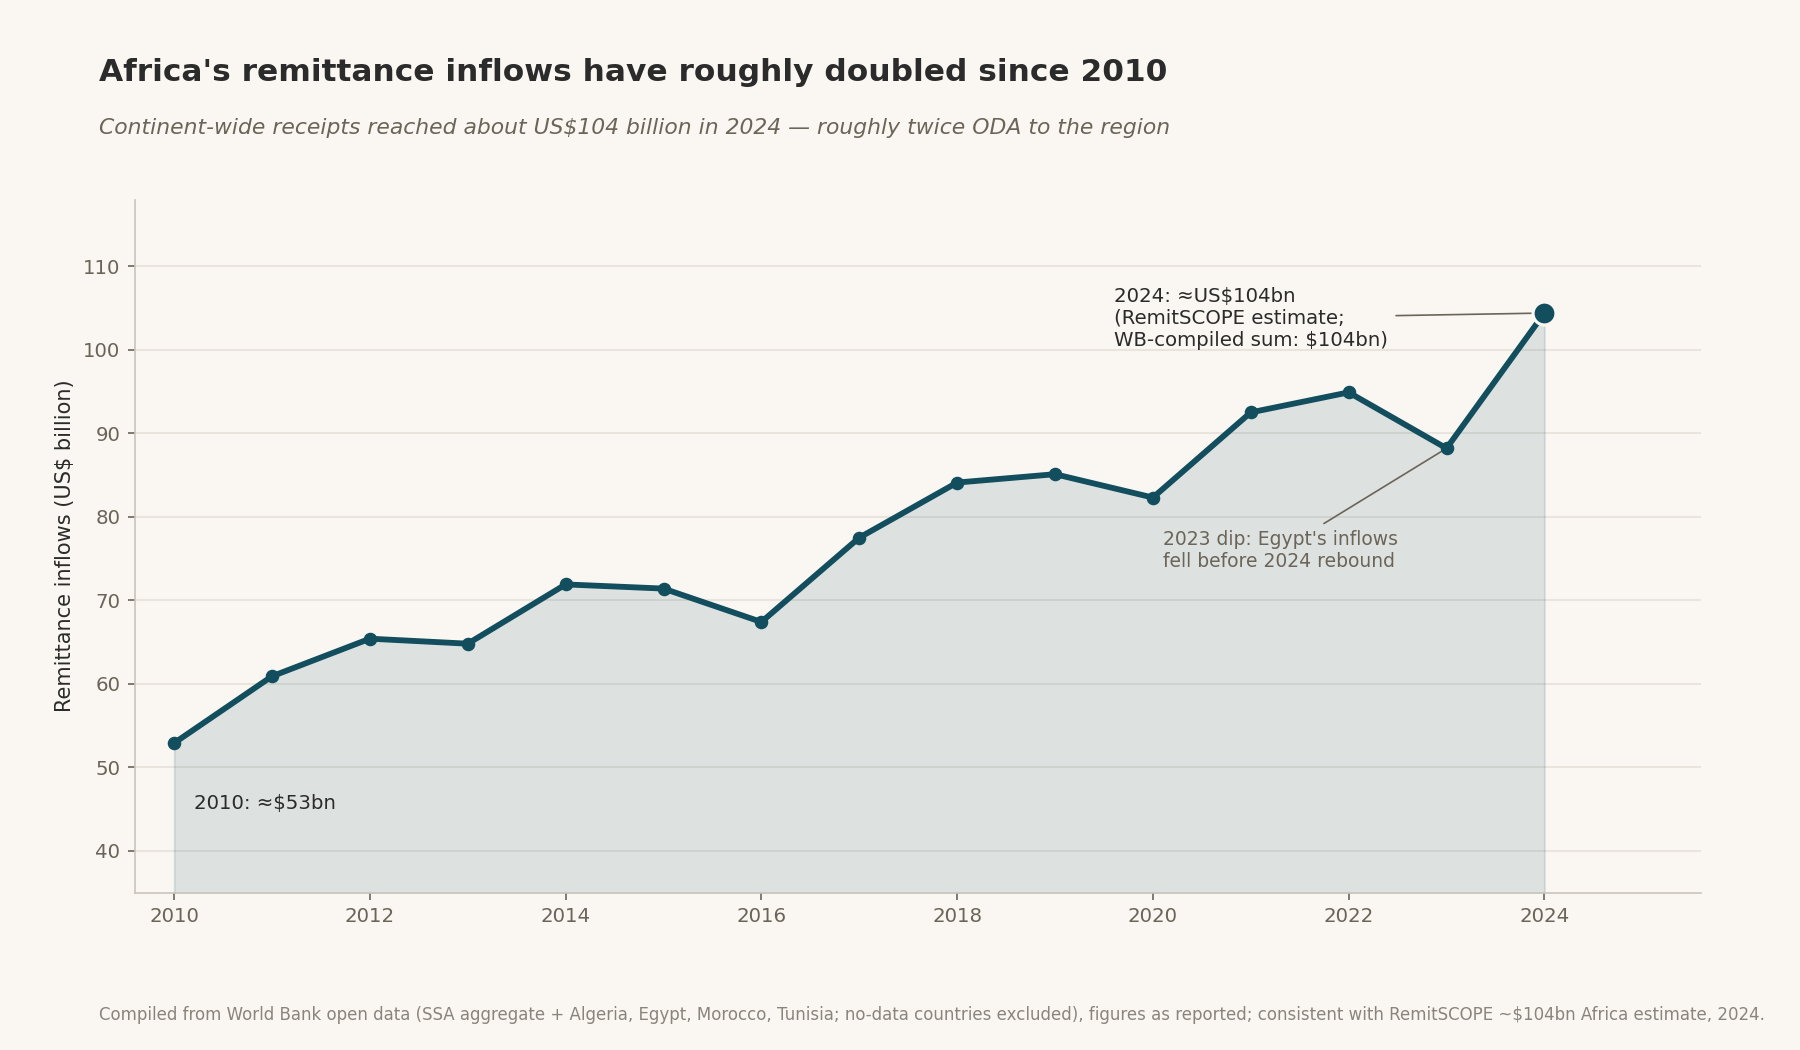
X: Sending $200 to Sub-Saharan Africa cost close to 9% in Q1 2025. Global average: 6.4%. SDG target: 3%. On roughly $100bn a year of inflows, that gap is billions in household income. The data →
LinkedIn: Remittances now exceed FDI and ODA combined for developing economies. They are also the most expensive external inflow Africa receives: close to 9% to send $200 to SubSaharan Africa in Q1 2025, against a 6.4% global average and a 3% SDG target. Research analysing 1,326 corridor observations attributes the gap to infrastructure and regulatory fragmentation, not market forces. That makes it a policy number, not a market one.
Author
Sign up for New Axis Media newsletters.
Stay up to date with curated collection of our top stories.